
POWERSCADA
Alarms: Panel, Ticker, Gantt Chart
PowerScada manages alarms as alarm tables containing alarm rules: each rule is a tag plus a condition, threshold, message and display style. The back end continuously compares cached values; when a condition is met it writes history first and then pushes the alarm to every connected screen, and records the recovery time when the condition clears.
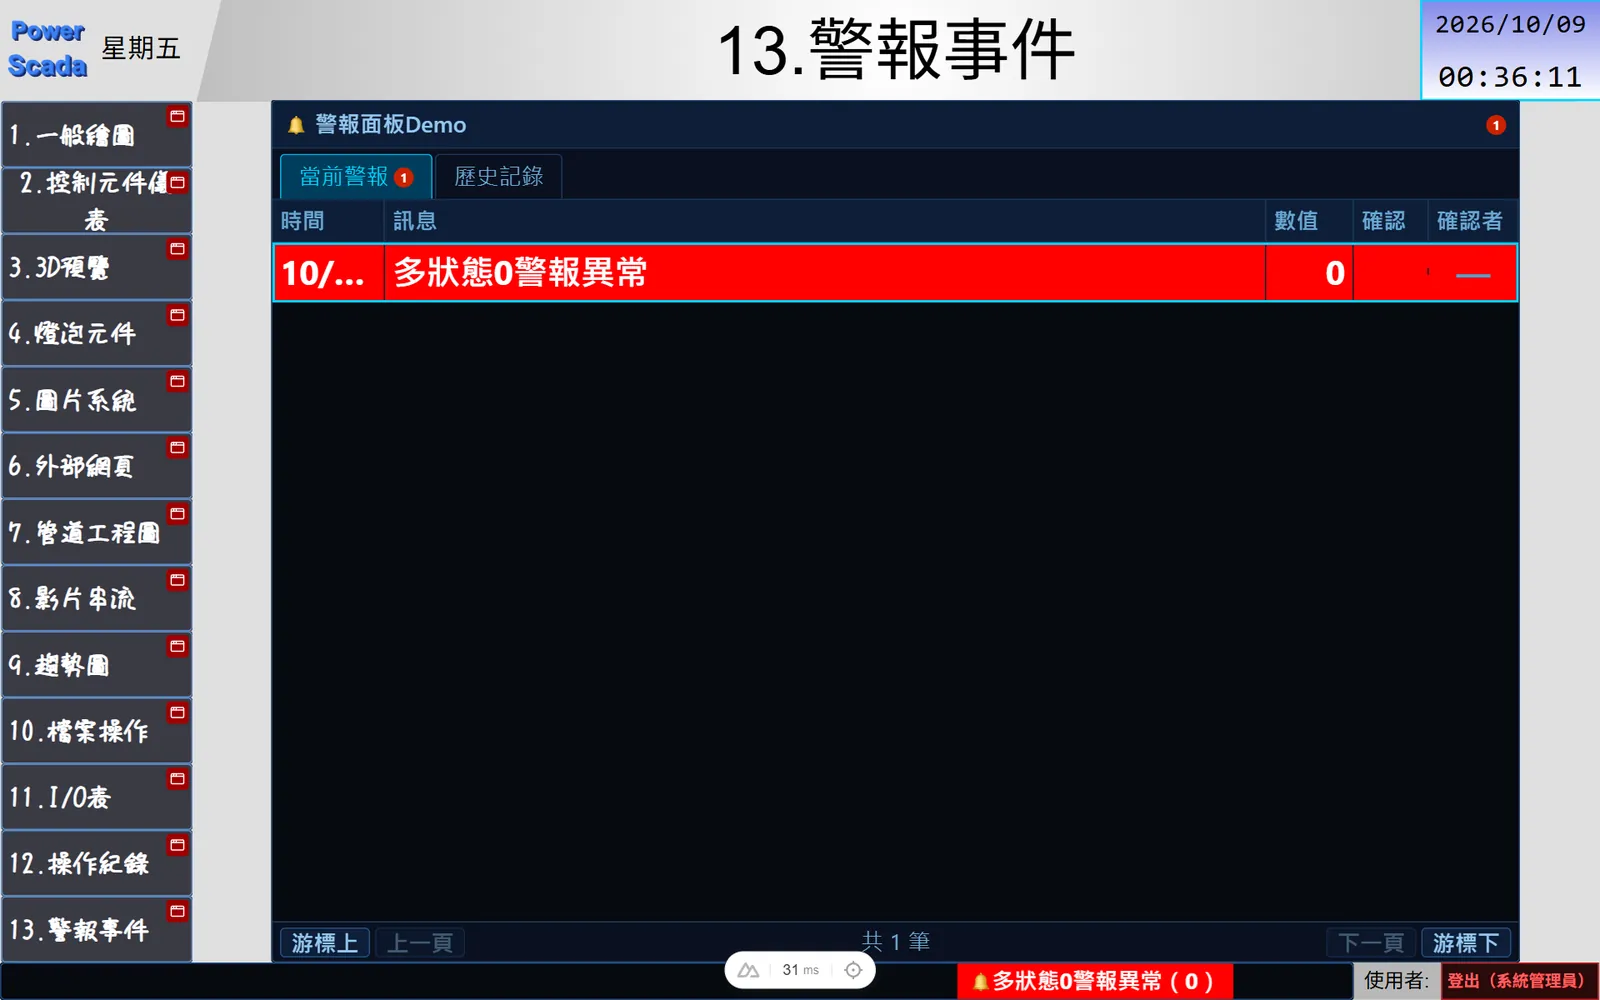
On the touch panel, operators see active alarms, acknowledge with one tap and click a row to jump to the matching page. Afterwards they can query the history, export to Excel, or use the Gantt chart to see the trigger and recovery timing of several alarms.
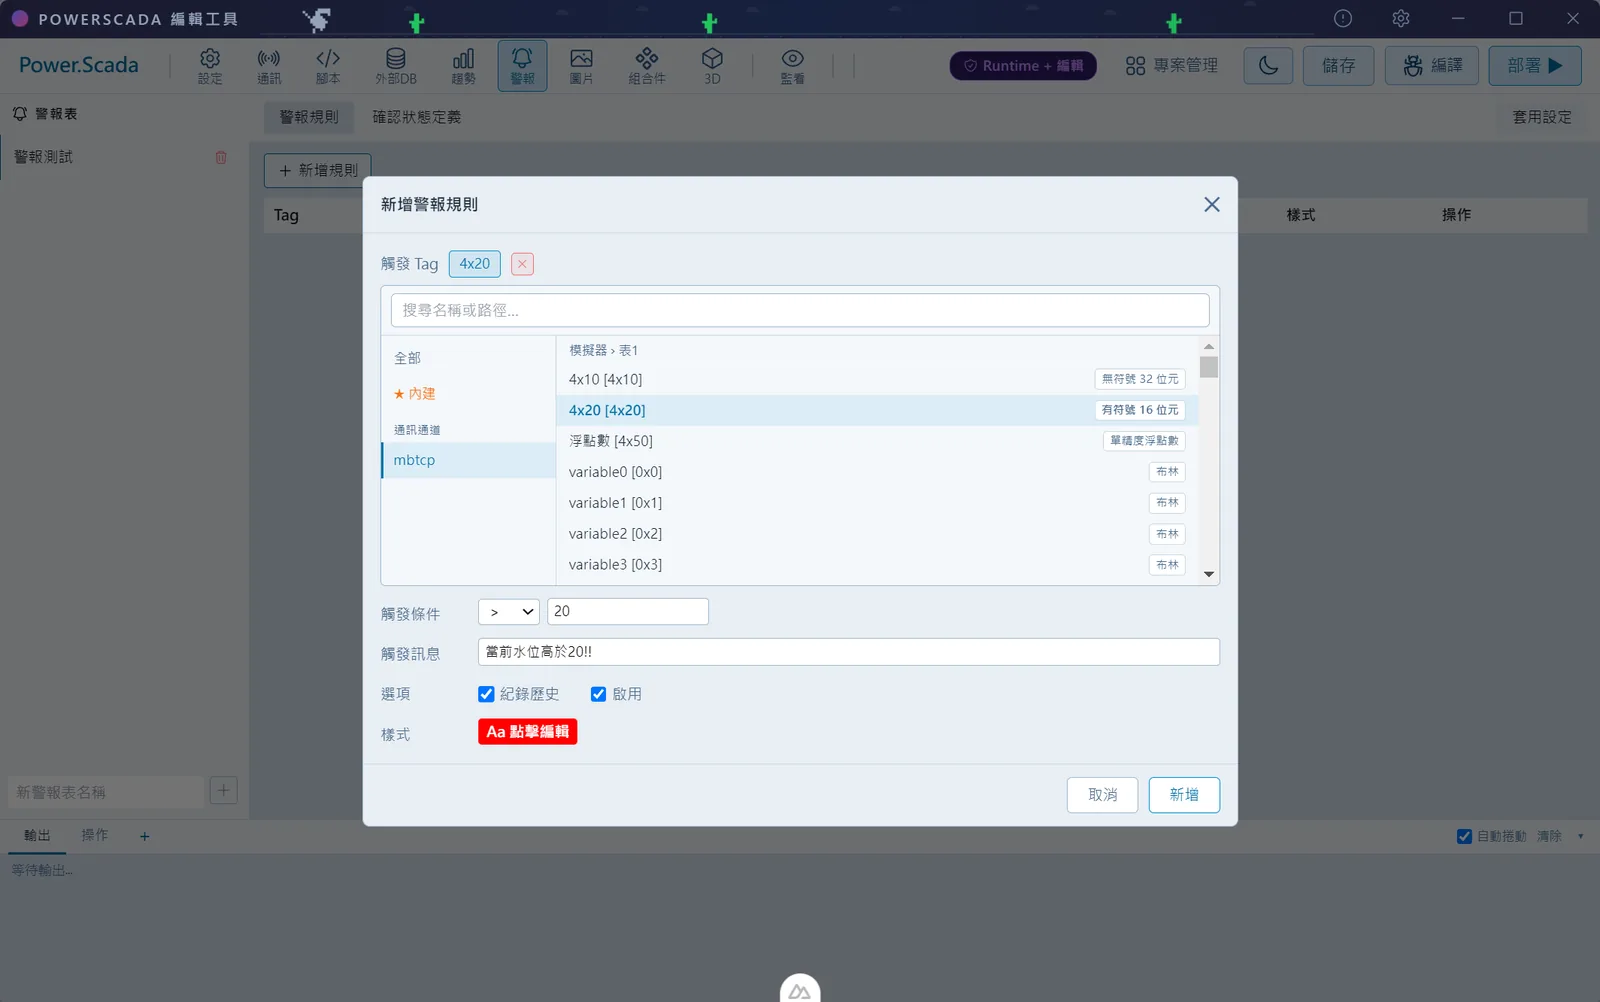
How rules are defined
Create alarm tables in the left column of the editor's Alarm Management panel and add rules row by row on the right. The tag can be an array element or a single bit from bit splitting.
- Conditions: greater than, less than, greater than or equal, less than or equal, equal; Boolean tags are written as equal to 1 or equal to 0.
- Each rule can set the trigger message, whether to log history, whether it is enabled, text and background styles, sort order, and the target page number and required permission level for "page navigation".
- Bulk add: the tag tree picker supports multi-select; the rule table is edited by clicking a cell, with bulk paste and undo/redo.
- A whole alarm table can be exported to and imported from Excel (16 columns); rules with the same tag, condition and threshold are skipped automatically, and a successful import takes effect immediately with no redeployment.
- Multiple acknowledge states can be defined (code, label, color); the acknowledging user is taken from the login account.
Three screen components
The alarm panel, alarm ticker and alarm Gantt chart are all updated by push from the system, with no page refresh needed.
- Alarm panel: Active and History tabs, bound to a single alarm table or showing all; columns (time, message, value, acknowledge, acknowledged by) are customizable and column widths are remembered after dragging. The paging and cursor controls in the footer can also be driven by 7 Boolean PLC tags, and the panel as a whole and the acknowledge action each have their own permission level.
- Alarm ticker: cycles through active alarms by horizontal scrolling or one entry at a time, suited to the top or bottom of a screen; shows custom text when there are no alarms.
- Alarm Gantt chart: one row per rule, with a bar from trigger to recovery and open bars extending to "now"; time window from 10 seconds to 30 days, up to 2000 records per load, with wheel, drag and pinch zoom plus 6 PLC control tags.
Sound, automatic actions and history
For sound or automatic handling, create a background task with a condition on the same tag and choose play alert sound (played on every open screen at the same time), trigger script or export Excel as the action; scripts can also sound the buzzer.
- History fields: rule, tag, message, trigger value, trigger time, recovery time, acknowledge state, acknowledge time and acknowledged by.
- History queries can filter by alarm table, rule, start and end time and acknowledge state; a schedule can export the last 7 days, this week, this month or a custom range to Excel.
- History can be stored in PostgreSQL, local SQLite (one file per table) or an external database, with backup and restore; in high availability (HA) mode the primary and standby sync automatically.
- The screensaver never covers a page that an unacknowledged alarm navigated to; disabling or deleting a rule clears its active alarms immediately.
Screenshots
How to set it up
- 1Open the Alarm Management panel from the editor top bar and create an alarm table by entering a name in the left column.
- 2Click "Add" or "Bulk add" in the right column to add rules, set the condition, threshold, message, style and page navigation, and click Save.
- 3For many rules, export to Excel first to get the format, edit in Excel and import or paste back.
- 4Place an alarm panel, ticker or Gantt chart on the screen, choose the alarm tables to show, and set the permission level and PLC control tags.
- 5For sound or automatic actions, create a background task under "Tasks": when the condition is met, play an alert sound, trigger a script or export Excel.
- 6After deployment, operators acknowledge on the panel or click a row to jump; history is on the panel's History tab, and long-term reports are exported on a schedule.
FAQ
FAQ
Can alarms be graded by severity?
There is no separate severity field. In practice, group them into different alarm tables and use each rule's own background color and font style; the panel, ticker and Gantt chart all use that color.
Can an alarm sound or trigger an action automatically?
Yes. Create a background task with a condition on the same tag and choose play alert sound (played on every open screen at the same time), trigger script or export Excel. A script can also sound the device buzzer or call an external API to send a notification.
Where is alarm history stored?
In PostgreSQL, a local SQLite file (one file per alarm table) or the customer's existing external database, with backup and restore; in high availability (HA) mode the primary and standby sync automatically.